
How the euro, dollar and pound moved against each other in 2024
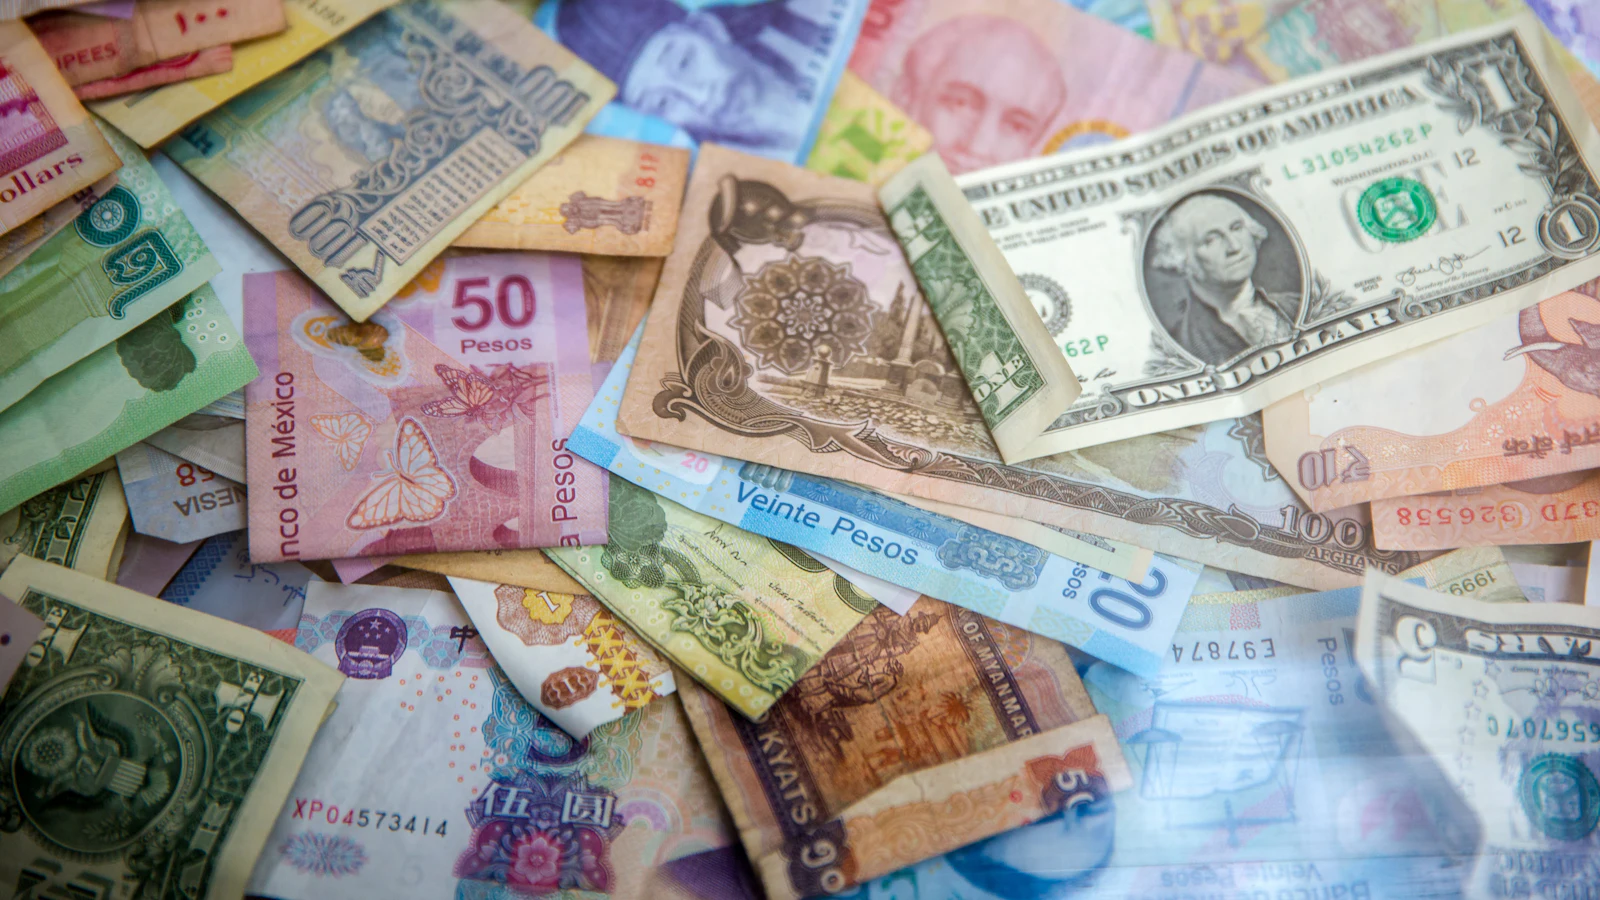
Photo by Jason Leung · Unsplash
10,000 euros converted to dollars in January 2024 and again in December would have produced two noticeably different amounts. Here is the shape of the year, and why the date you convert on matters.
10,000 euros converted to dollars at the start of 2024 would have produced roughly $11,000; the same 10,000 euros converted at the end of the year would have produced closer to $10,400. Nothing about the euros changed — what moved was the exchange rate itself, over twelve months in which the dollar broadly strengthened and the pound broadly firmed against both. None of these moves were unusual by the standards of currency markets, but they were large enough to matter to anyone sending money, pricing an invoice, or budgeting a trip across the year.
The shape of 2024, three pairs
| Pair | Approx. start of 2024 | Approx. range during the year | Approx. end of 2024 |
|---|---|---|---|
| EUR/USD | ~1.10 | 1.04 – 1.12 | ~1.04 |
| GBP/USD | ~1.27 | 1.23 – 1.34 | ~1.25 |
| GBP/EUR | ~1.155 | 1.15 – 1.21 | ~1.20 |
Two patterns sit inside that table. The dollar strengthened against the euro through the year, especially in the final quarter, which is why EUR/USD ended lower than it started. Separately, the pound firmed against both the dollar and the euro for most of the year — GBP/USD touched roughly 1.34 in September 2024, a level sterling had not reached in over two years, before pulling back somewhat into year-end alongside the dollar's broader strength. The GBP/EUR move follows from the other two: because the dollar gained more against the euro than against the pound, the pound ended up stronger against the euro too.
Why the dollar strengthened in the second half of 2024
Currency moves this size usually come from interest rate differences and shifting expectations rather than any single event. Through late 2024, US economic data came in stronger than expected even as the Federal Reserve cut rates, which narrowed how much further US rates were expected to fall relative to the eurozone — a smaller expected rate gap, all else equal, tends to support the currency of the country cutting less. Market expectations around US fiscal and trade policy following the November 2024 election added further momentum to the dollar in the final weeks of the year. None of this was a single announcement; it was a gradual shift that shows up clearly only when the whole year is viewed at once.
What the move was actually worth on a transfer
Exchange rate moves are easiest to see in a specific transaction rather than as an abstract percentage:
| Amount | Converted at January 2024 rate | Converted at December 2024 rate | Difference |
|---|---|---|---|
| €10,000 → USD | ~$11,000 (at 1.10) | ~$10,400 (at 1.04) | ~$600 less |
| £10,000 → USD | ~$12,700 (at 1.27) | ~$12,500 (at 1.25) | ~$200 less |
| €10,000 → GBP | ~£8,658 (at 1.155) | ~£8,333 (at 1.20) | ~£325 less |
For anyone receiving income in one currency and spending in another — a remote worker paid in dollars but living in the eurozone, a pensioner receiving a pound-denominated payment abroad, a business invoicing internationally — this is not an abstract statistic; it is the difference between what was budgeted and what actually arrived. The EUR/USD converter, the EUR/GBP converter and the euros to pounds calculator all use the current live rate, not a historical average, for exactly this reason.
Why every figure here is rounded, deliberately
Exchange rates move continuously, every business day, often noticeably within a single day around a major economic release. The ranges above describe the general shape of 2024 well enough to explain what happened and why, but they are not a substitute for the rate on a specific date. Central banks publish their own daily reference rates for exactly this reason — the European Central Bank's euro reference rates are the standard record for what the euro was actually worth against other currencies on any given day, and are the source to check rather than an approximate range from an article written afterward.
The rate you see quoted is rarely the rate you get
Every figure in this article is the mid-market rate — the midpoint between what buyers and sellers of a currency are quoting each other on the wholesale market, and the number that shows up in a Google search or a news report. It is not the rate a bank, a currency exchange counter, or most money transfer services will actually give you. Retail providers build in a margin on top of the mid-market rate, commonly 1% to 3% for a bank and sometimes considerably more at an airport exchange counter, on top of any flat fee they charge separately. On a $10,000 transfer, a 2% margin costs $200 that never shows up as a separate line item — it is simply baked into a worse exchange rate than the mid-market one. Comparing providers on their actual rate against the mid-market figure, not on their advertised "no fee" transfers, is the only way to see the real cost of a transfer.
What this is useful for, practically
- If you are comparing an invoice, a salary, or a past transfer against "what it should have been," check the actual rate on the actual date rather than a yearly average — the range in the table above can be a factor of five or more different from a single day's rate during a volatile week.
- If you send money internationally on a recurring basis, the year's range is a useful sense check for whether a quoted rate from a transfer service is reasonable, since services routinely add a margin on top of the reference rate.
- None of the figures above predict what any pair will do going forward — they describe what already happened, which is the only thing that can be stated with confidence about a currency market.
This is general information, not financial advice. All figures are rounded and illustrative. For any actual transaction, use a live rate at the time of the transfer rather than the approximate ranges above.